Human Innovation Timeline – full-size image
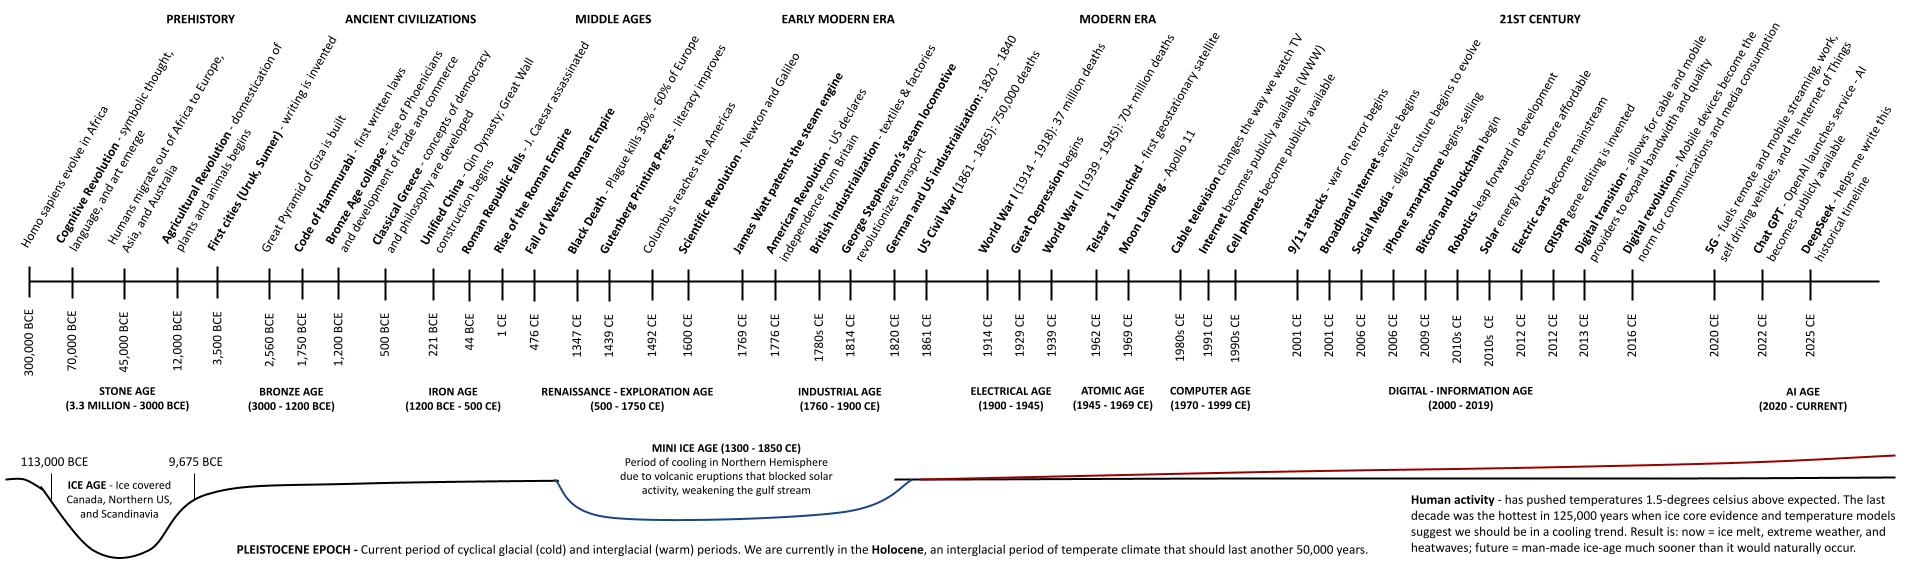
Nothing happens in a vacuum, and a visual timeline can make it easier to understand how historical events are related. I make timelines like this one for myself when I want to visualize multiple layers of data, and better understand the circumstances that contributed to an event.
For example, in the timeline you can see how the Mini Ice Age began and was quickly followed by the Black Death. By seeing how these two events line up it’s easy to see how a climate change induced famine, combined with an unfamiliar disease could align to create a perfect storm.
Leave a Reply